


What’s your portfolio’s carbon footprint?
Dr. David Allen
Investors are starting to recognise that the carbon footprints of their portfolios often dwarf the carbon footprint of their day to day lives. The carbon footprint of a portfolio is driven by the companies that the portfolio is invested in, for example, the emissions of Qantas, BHP, or Bega Cheese (those pesky cows!).
Let’s do the maths. To keep things simple, let’s assume that an investor holds a single asset, an ASX 200 index fund. The ASX 200 has a carbon footprint of 95.3 tons of CO2 per million dollars invested.
The chart below shows the tons of CO2 for different portfolio sizes.
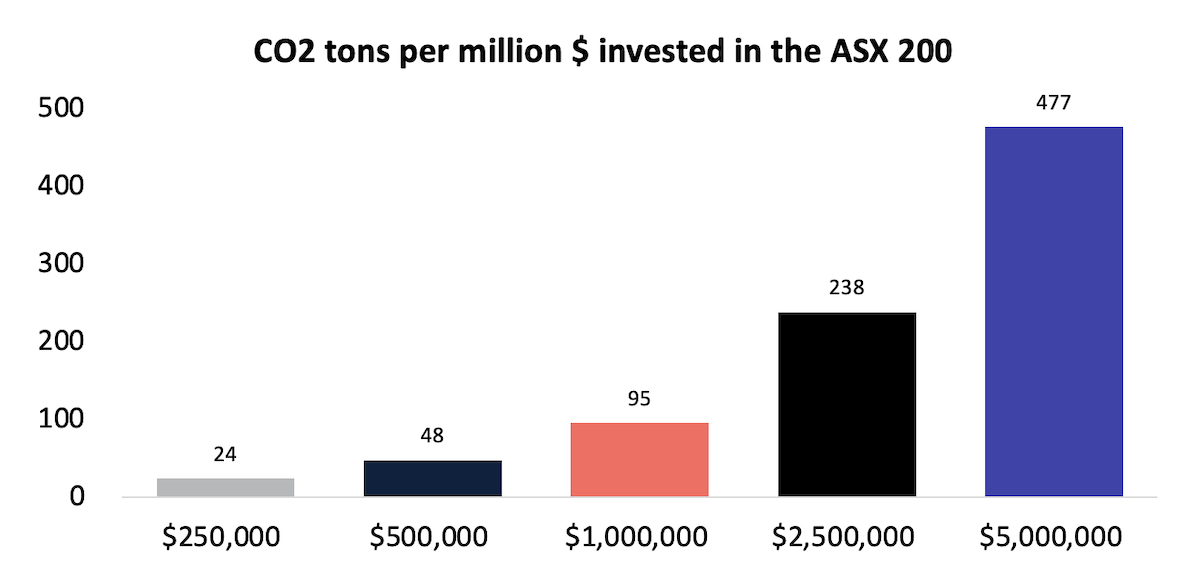
For a $500,000 portfolio, the total carbon emissions are 48 tons. This is almost three times the carbon footprint of the average Australian per year. This multiple is made all the more striking given that in Australia we are in the unenviable position of having the 3rd highest carbon footprints per capita in the developed world, amounting to 17 tons of CO2 per person, or 75% higher than the OECD average. For a large portfolio size of $2.5 million, the carbon footprint is 238 tons, or equivalent to 14 times of the average Australian.
It is often hard to relate to raw CO2 numbers, so let’s put it in everyday terms. The $1m portfolio produces as much carbon as…
- 1,271 flights from Sydney to Melbourne
- Driving to work 13,236 times
- 10,588 beef burgers
- Sequestered by 13,108 trees per year
No wonder investors are really starting to take note of the carbon emitted by their investments.
About the Author

Dr David Allen is head of Short/Long Strategies at Plato, managing the Plato Global Net Zero Hedge Fund. He holds a PhD from Cambridge and Bachelor of Business with First Class Honours.
“A good decision is based on knowledge and not on numbers.”
Plato (427-347 BC)